如何判断趋势

· Views 703
在交易的过程中,行情的波动一般有两种,第一种为在一定的区间内呈现震荡走势,另一种就是单边行情。
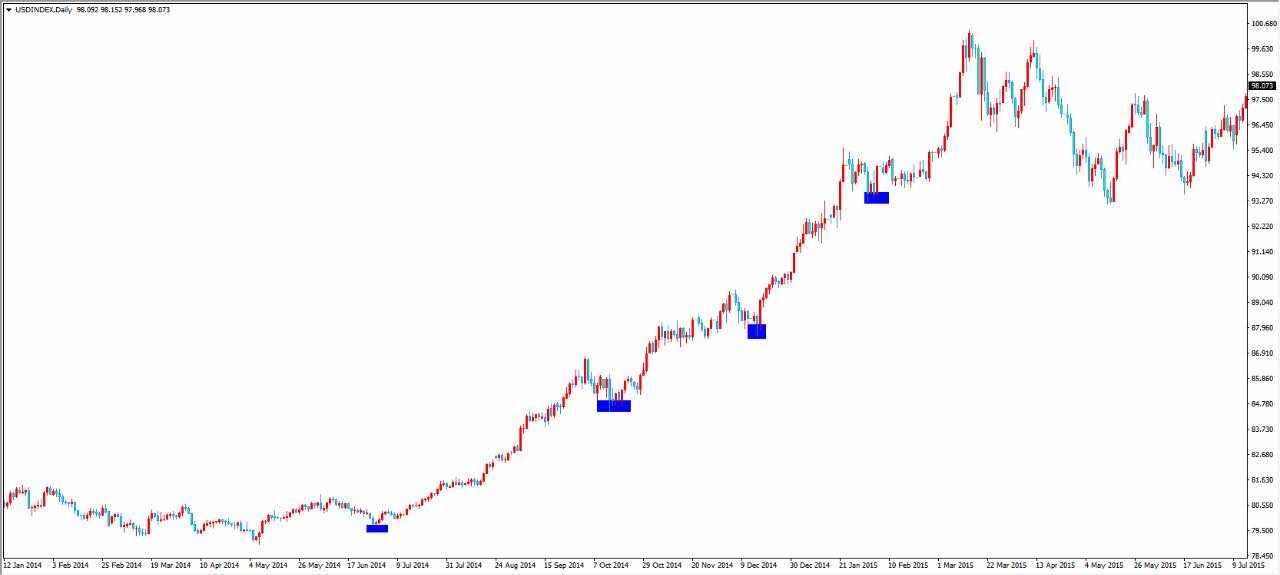
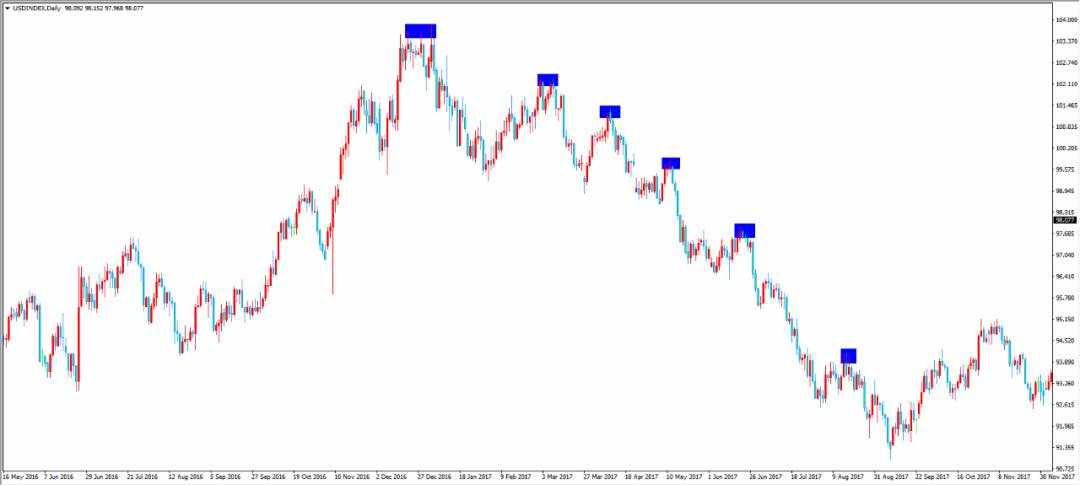
单边行情一般指价格沿着某种趋势(上涨或下跌)运动的行情。其表现形式为低点不断抬高(上涨趋势)、高点不断降低(下跌趋势)。如下图
如图为上涨趋势1
下跌趋势图2
往往一波单边行情将会有上千点甚至破万点的大波动,假如我们能够抓住其中的一段行情,收益也会相当可观。那么如何把握单边行情?最简单的办法就是画趋势线。
两点成一线,只要把上面图中的各个低点/高点连起来就是趋势线了,在上涨趋势过程中,趋势线就是支撑线,当价格回踩趋势线的时候就是买入的时机,而上一波的低点,就是我们的止损点;同理,在下跌趋势的过程中,趋势线就是阻力线,当价格回踩趋势线的时候就是卖出的时机,而上一波的高点,就是我们的止损点。
如下图,A点和B点连接形成上涨趋势线,当K线回踩趋势线出现低点C的时候选择做多,止损设在上一个低点B。如图所示
两点成一线,只要把上面图中的各个低点/高点连起来就是趋势线了,在上涨趋势过程中,趋势线就是支撑线,当价格回踩趋势线的时候就是买入的时机,而上一波的低点,就是我们的止损点;同理,在下跌趋势的过程中,趋势线就是阻力线,当价格回踩趋势线的时候就是卖出的时机,而上一波的高点,就是我们的止损点。
如下图,A点和B点连接形成上涨趋势线,当K线回踩趋势线出现低点C的时候选择做多,止损设在上一个低点B。如图所示
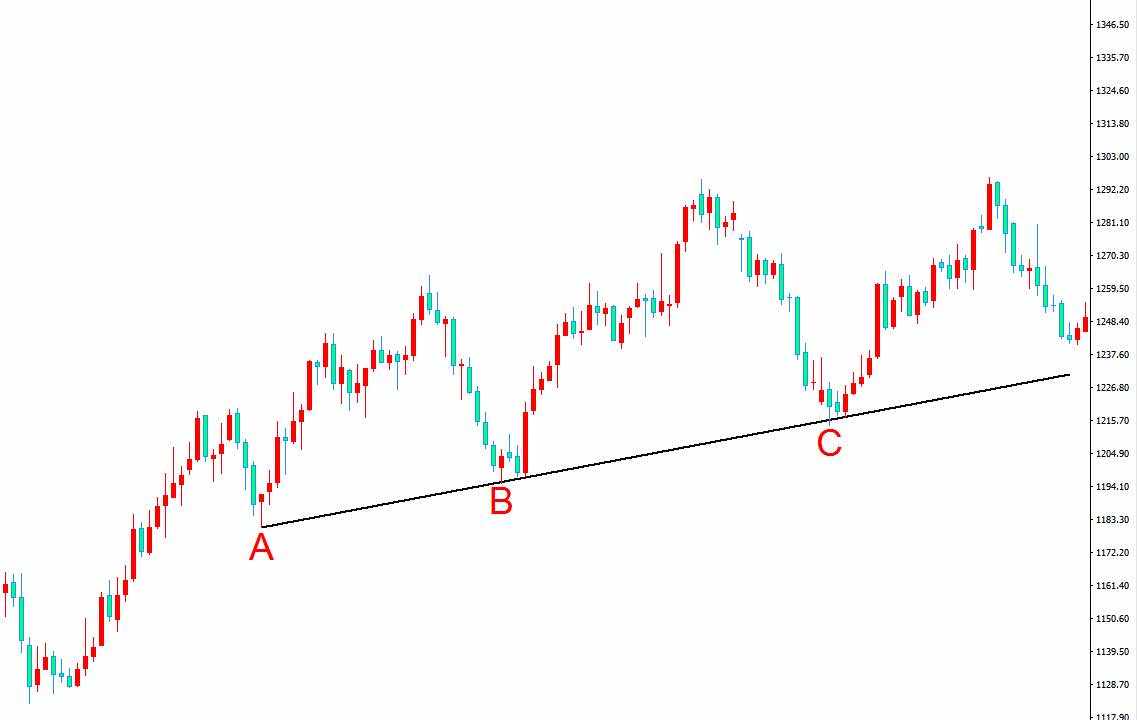
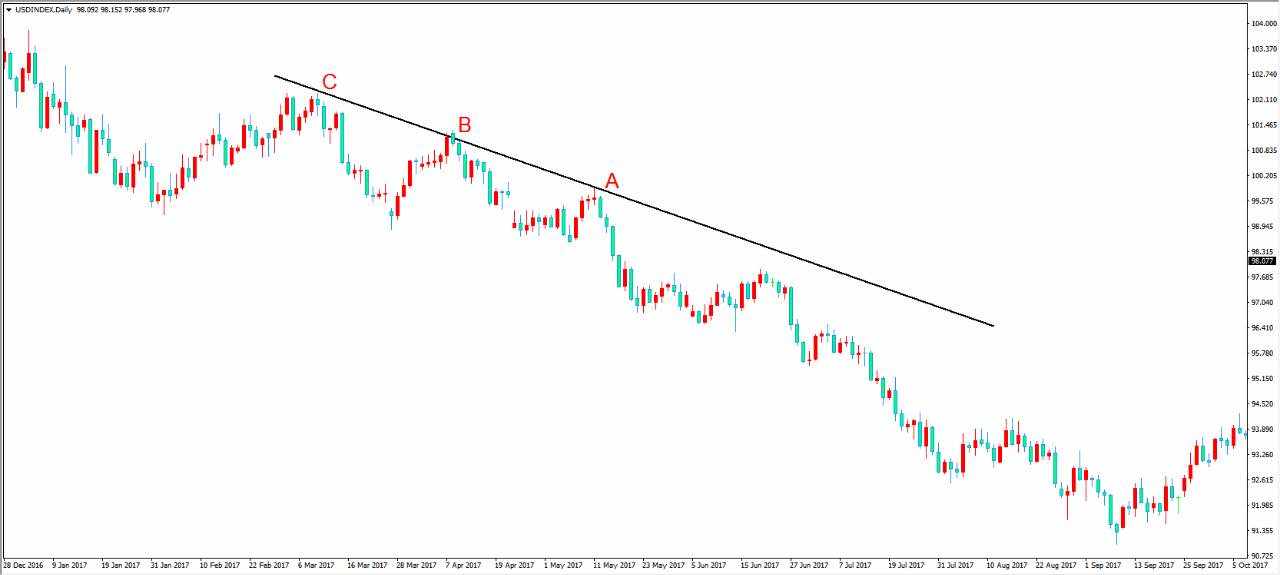
C点和B点形成下跌趋势线,当K线回踩趋势线出现高点A的时候选择做空,止损设在上一个高点B。
趋势线的缺陷
趋势线是做单边行情最简单有效的方法之一,但是它并不完美。有时候会有假突破的情况出现,导致趋势线失败。根据个人经验,第三次触及趋势线准确率较高,超过三次触及可能会失效。同时,投资者可以适当结合均线、MACD等趋势性的指标一起来配合使用,胜率也将会有所提升。
Disclaimer: The content above represents only the views of the author or guest. It does not represent any views or positions of FOLLOWME and does not mean that FOLLOWME agrees with its statement or description, nor does it constitute any investment advice. For all actions taken by visitors based on information provided by the FOLLOWME community, the community does not assume any form of liability unless otherwise expressly promised in writing.
FOLLOWME Trading Community Website: https://www.followme.com
If you like, reward to support.


Hot
No comment on record. Start new comment.