
如下表1所示,该形态为反转看涨形态。通过统计分析,在外汇交易中该形态出现次数较多,在5分钟周期中,16种货币对均具有正的平均收益。从盈亏比的角度分析,16种货币对的盈亏比基本维持在1附近,其中CHFJPY、USDCAD和NZDUSD的盈亏比略大于1;从成功率的角度分析,所有货币对均取得大于50%的成功率,其中,GBPCHF具有最高成功率55.44%。与此同时,GBPCHF取得最高的单次交易平均价差9.095 7。统计结果说明,倒锤子线形态在5分钟周期的外汇交易中具有一定的参考意义。
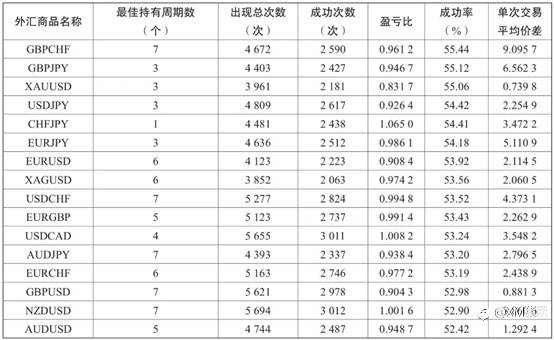
表1: 倒锤子线形态出现后的指标统计(5分钟周期)
表2所示,在30分钟周期中,EURJPY的数据表现最好,其成功率为60.42%,盈亏比为1.274 3,单次交易平均价差超过30。此外,XAGUSD,USDCAD的盈亏比均大于1。同5分钟周期相比,这些货币对在30分钟周期中的成功率有明显提升。
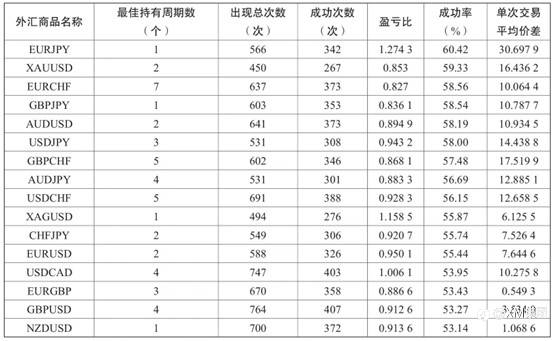
表2: 倒锤子线形态出现后的指标统计(30分钟周期)
表3所示,在日线周期中,该形态出现次数明显减少,但成功率大幅提高。其中,XAGUSD出现该形态7次,成功6次,成功率达到85.71%;USDCHF的成功率达到80%,盈亏比超过4,单次交易平均价差超过1.280,具有较好的收益表现。与此同时,相比5分钟和30分钟周期,它们的盈亏比也普遍提高。
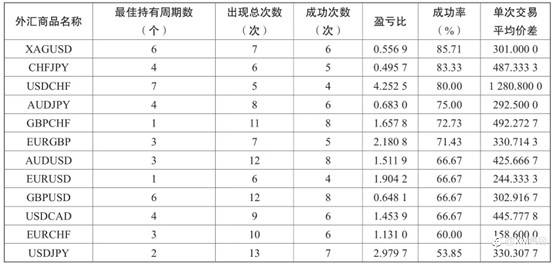
表3: 倒锤子线形态出现后的指标统计(日线周期)
Disclaimer: The views expressed are solely those of the author and do not represent the official position of Followme. Followme does not take responsibility for the accuracy, completeness, or reliability of the information provided and is not liable for any actions taken based on the content, unless explicitly stated in writing.


Leave Your Message Now