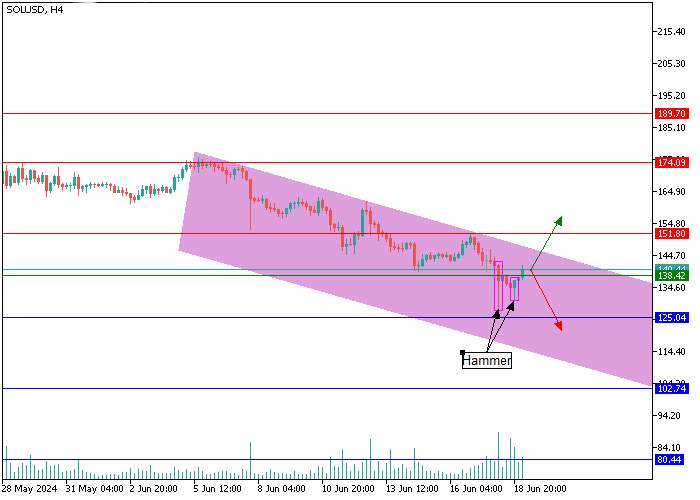
SOL/USD, H4
On the four-hour chart at the level of 138.42, a series of Hammer candlestick analysis patterns are being built within the framework of a short-term downtrend, signaling the increasing activity of "bulls" in the market and warning of a likely trend reversal. In the current situation, most likely, buyers will attempt to overcome its upper limit, restoring lost positions above the resistance level of 151.80, the breakdown of which could become a catalyst for achieving targets 174.09–189.70. An alternative scenario is realized if the "bears" consolidate their positions below the key support level of 125.04, then the negative dynamics for the instrument may intensify to the area of 102.74–80.44.

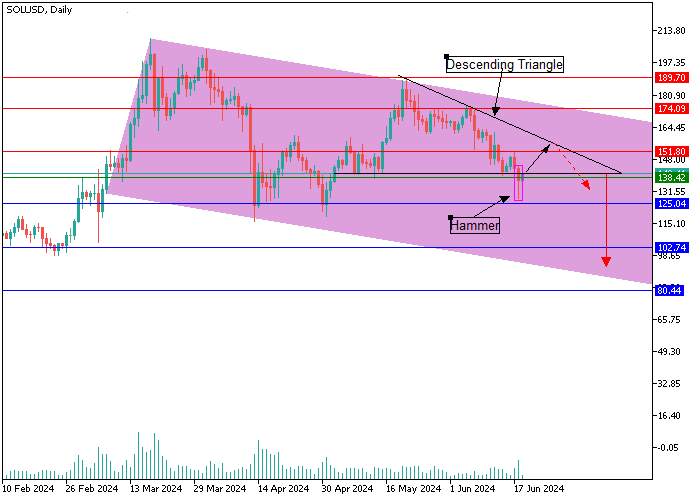
SOL/USD, D1
On the daily chart, a large Descending Triangle graphic pattern is being built, and the price is testing its lower border. The quotes may leave this model downwards with a potential target at the level of 102.74 and below. However, the possibility of overcoming the upper limit cannot be ruled out. A likely signal for the implementation of a positive scenario is the formation of a Hammer candlestick pattern at the level of 138.42, but to confirm the "bullish" dynamics buyers need to restore lost positions above the level of 151.80, which will allow them to continue moving to the area of 174.09–189.70.
Support and resistance
Support levels: 125.04, 102.74, 80.44.
Resistance levels: 151.80, 174.09, 189.70.
Trading tips
Long positions can be opened above 151.80 with targets at 174.09, 189.70. Stop-loss — 138.42. Implementation time: 7 days and more.
Short positions can be opened below the level of 125.04 with targets at 102.74, 80.44. Stop-loss — 138.42.


Hot
No comment on record. Start new comment.