NI 225: JAPANESE STOCK MARKET CONTINUES ITS DOWNWARD CORRECTION

| Scenario | |
|---|---|
| Timeframe | Weekly |
| Recommendation | SELL STOP |
| Entry Point | 39700.0 |
| Take Profit | 38100.0 |
| Stop Loss | 40000.0 |
| Key Levels | 38100.0, 39700.0, 40500.0, 42230.0 |
| Alternative scenario | |
|---|---|
| Recommendation | BUY STOP |
| Entry Point | 40500.0 |
| Take Profit | 42230.0 |
| Stop Loss | 40000.0 |
| Key Levels | 38100.0, 39700.0, 40500.0, 42230.0 |
Current trend
The leading Japanese stock index NI 225 is correcting in a downward trend at the level of 40076.0 against the background of the continuing slowdown of the national economy.
Today, June foreign trade data was published, which confirmed a decrease in activity in both categories of trade turnover: Exports added 5.4%, below both the 6.4% expected by analysts and the 13.5% recorded in the previous month, while Imports increased 3.2%, falling short of the projected 9.3% and down from 9.5% a month earlier. The reduction in purchases had a positive impact on the trade balance, which amounted to 224.0 billion yen, higher than the deficit of 1.22 trillion yen last month.
Against the backdrop of ongoing problems in the economy and the gap in interest rates between the Bank of Japan and regulators of other developed countries, the bond market is showing unstable dynamics: 10-year debt securities fell to a yield of 1.057% compared to 1.072% last week, 20-year bonds — to 1.871% from 1.885%, and 30-year bonds — to 2.187% from 2.222%.
The growth leaders in the index are Nichirei Corp. ( 6.34%), Ajinomoto Co., Ltd. ( 3.33%), Kansai Electric Power Co., Inc. ( 3.28%), Asahi Group Holdings, Ltd. ( 3.27%).
Among the leaders of the decline are Tokyo Electron Ltd. (–8.86%), Dainippon Screen Mfg. Co., Ltd. (–8.34%), Hoya Corp. (–7.49%).
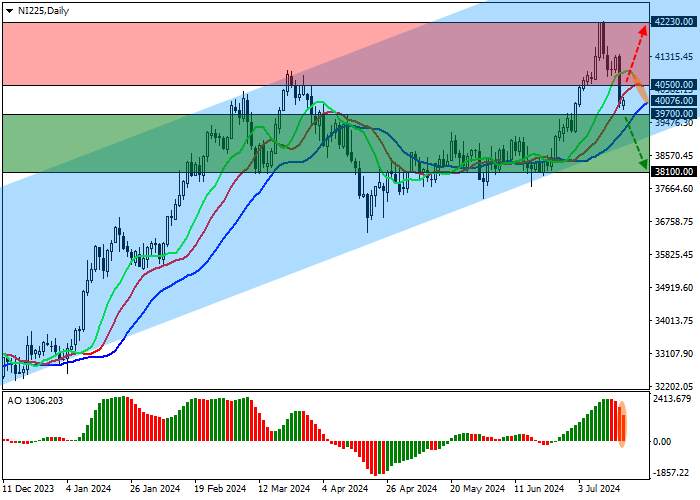
Support and resistance
On the daily chart, the price is approaching the support line of the ascending channel with dynamic boundaries of 44000.0–39000.0.
Technical indicators are preparing to continue weakening the previously received buy signal: the AO histogram is forming new descending bars, and fast EMAs on the Alligator indicator are approaching the signal line, narrowing the range of fluctuations.
Support levels: 39700.0, 38100.0.
Resistance levels: 40500.0, 42230.0.

Trading tips
If the asset reverses and continues declining, and the price consolidates below 39700.0, short positions can be opened with the target at 38100.0. Stop-loss — 40000.0. Implementation time: 7 days and more.
If the asset continues to grow and consolidates above the resistance level of 40500.0, buy positions with a target of 42230.0 will be relevant. Stop-loss — 40000.0.
Disclaimer: The content above represents only the views of the author or guest. It does not represent any views or positions of FOLLOWME and does not mean that FOLLOWME agrees with its statement or description, nor does it constitute any investment advice. For all actions taken by visitors based on information provided by the FOLLOWME community, the community does not assume any form of liability unless otherwise expressly promised in writing.
FOLLOWME Trading Community Website: https://www.followme.com


Hot
No comment on record. Start new comment.