Current trend
The leading index of the London Stock Exchange FTSE 100 is demonstrating upward dynamics at 8338.0, supported by a correction in the bond market and positive macroeconomic statistics from the UK.
Thus, yesterday, the August data on the housing price index from Rightmove Group Ltd. was presented. It fell from –0.4% to –1.5% MoM but adjusted from 0.4% to 0.8% YoY. In addition, a 19.0% increase in the number of requests for the purchase of new homes was recorded (positive dynamics are observed for the first time since the Bank of England’s decision to reduce the cost of borrowing from 5.25% to 5.00%), which is a positive signal for the national stock market.
Meanwhile, yields across the entire debt portfolio are rising again, with 10-year bonds trading at 3.926%, up from 3.836% last week, 20-year bonds holding at 4.380%, above the 4.322% previously recorded, and global 30-year bonds rising to 4.461% from 4.403%.
The index’s growth leaders are Barratt Developments Plc. ( 3.40%), Glencore Plc. ( 2.81%), Fresnillo Plc. ( 2.54%), and Burberry Group Plc. ( 2.33%).
Among the leaders of the decline are Hikma Pharmaceuticals Plc. (–1.55%), Spirax-Sarco Engineering Plc. (–0.99%) and Admiral Group Plc. (–0.91%).
Support and resistance
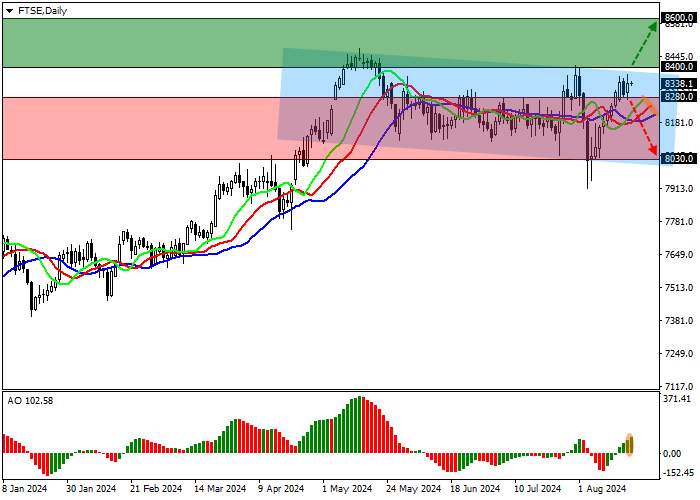
On the daily chart, the FTSE 100 continues a local correction and is currently holding just below the resistance line of the downward channel 8400.0–8000.0.
Technical indicators are in the state of a new signal to open long positions: the EMA oscillation range on the Alligator indicator is expanding in the direction of growth, and the AO oscillator histogram is forming new correction bars, rising in the purchase zone.
Support levels: 8280.0, 8030.0.
Resistance levels: 8400.0, 8600.0.

Trading tips
Long positions may be opened after the price consolidates above the resistance level of 8400.0, with the target at 8600.0 and stop loss 8300.0. Implementation period: 7 days or more.
Short positions may be opened after the price consolidates below the support level of 8280.0, with the target at 8030.0. Stop loss — 8360.0.


Hot
No comment on record. Start new comment.