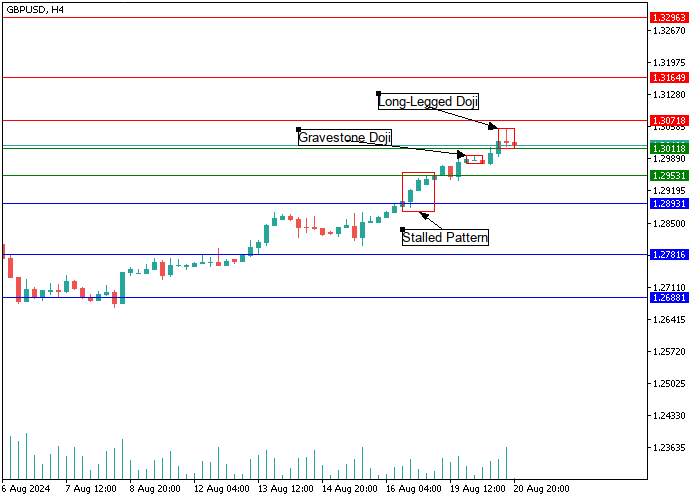
GBP/USD, H4
On the four-hour chart, the quotes of the trading instrument are holding around 1.3011, having formed a Stalled Pattern, which is a variation of the trend continuation pattern Three Advancing White Soldiers, at 1.2893−1.2953, signaling the weakening of the leading "bullish" positions. In turn, the appearance of Gravestone Doji and Long-Legged Doji formations around 1.3011 confirms the continuing uncertainty in the market. If buyers manage to consolidate above the key resistance level of 1.3071 on increased volumes, the price may reach 1.3164−1.3296. However, after a breakdown of the support line of 1.2893, the negative dynamics may intensify to 1.2781−1.2688.

GBP/USD, D1
On the daily chart, the quotes are trading within a stable uptrend, forming a Bull Harami candlestick analysis pattern. At the moment, a Stalled Pattern of the Three Advancing White Soldiers candlestick formation has already appeared near the key resistance level of 1.3071, signaling increasing pressure from sellers. Strengthening of the upward dynamics is possible after a breakout and consolidation above 1.3071, allowing the instrument to test the range of 1.3164−1.3296.

Support and resistance
Support levels: 1.2893, 1.2781, 1.2688.
Resistance levels: 1.3071, 1.3164, 1.3296.
Trading tips
Long positions may be opened above 1.3071, with the targets 1.3164 and 1.3296. Stop loss – 1.3011. Implementation period: 9–12 days.
Short positions may be opened below 1.2893, with the targets 1.2781 and 1.2688. Stop loss – 1.2953.


Hot
No comment on record. Start new comment.