Current trend
Shares of Alibaba Group Holdings Ltd., one of the largest companies in the field of e-commerce, are trading at 81.00.
Investors are analyzing the Q2 financial report, which recorded a decrease in net profit by 29.0% to 24.27B yuan compared to the same period last year but revenue was corrected by 4.0% YoY to 243.23B yuan but showed negative dynamics in the e-commerce sector, falling by 1.0%. According to experts, this was due to product promotions that Alibaba Group Holdings Ltd. and JD.com Inc. platforms set up to maintain sales momentum. Despite the ongoing problems in China, the company improved its performance overseas, with revenue from its international e-commerce division growing 32.0% to 29.30B yuan, while its relatively new cloud segment added 6.0% to 26.55B yuan. As for earnings per share, they returned to stable levels around 16.44 yuan, beating analysts' forecast of 15.00 yuan.
In July, the company paid dividends in two tranches: the first was 0.98 yuan per share, and the second was 0.66 yuan, which, when converted to annualized yield, exceeds 4.36%.
Support and resistance
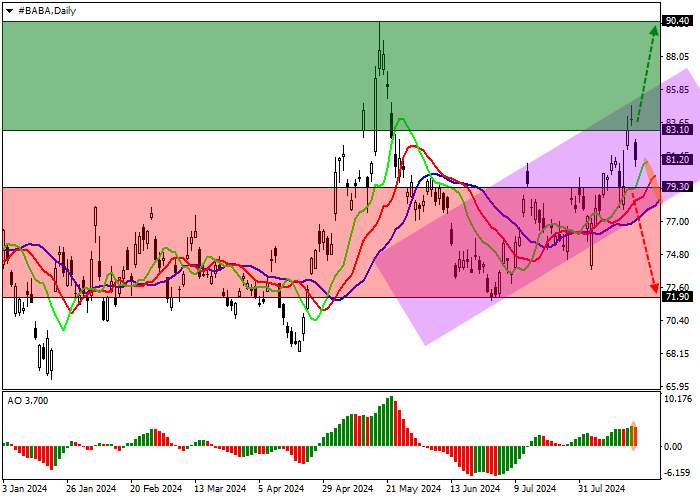
On the daily chart, an ascending channel continues to form with boundaries of 86.00–79.00. Technical indicators are in the state of a buy signal, which has strengthened after the publication of the report: the EMA oscillation range on the Alligator indicator has begun to expand, and the AO oscillator histogram, being in the buy zone, is forming new ascending bars.
Support levels: 79.30, 71.90.
Resistance levels: 83.10, 90.40.

Trading tips
Long positions may be opened after the price has consolidated above the resistance level of 83.10, with the target at 90.40. Stop loss – 81.00. Implementation period: 7 days or more.
Short positions may be opened after the price has consolidated below the support level of 79.30, with the target at 71.90 and stop loss 82.00.


Hot
No comment on record. Start new comment.