Current trend
Amid the slowdown in the downward dynamics of the American dollar, the USD/JPY pair is trying to regain its position, correcting around 144.71. The key driver for the yen’s strengthening remains the monetary authorities’ rhetoric aimed at a systematic increase in the interest rate, which will reduce the gap with the US interest rate.
Tomorrow, traders will pay attention to the inflation data. The consumer price index in the Tokyo region is likely to remain at 2.2%, like the core indicator. In turn, the volume of industrial production, which records the amount of manufactured industrial goods and utilities in the country, taking into account the manufacturing and mining industries, as well as the electric power industry, in July may increase from –4.2% to 3.3% MoM, and retail sales may decrease from 3.7% to 2.9% YoY. It is difficult to assess how these statistics will impact the emerging trend of monetary tightening by the Bank of Japan officials, who have previously said they will not take active action during market uncertainty.
The American dollar is trading close to yearly lows at 100.80 in the USDX ahead of tomorrow’s data, with analysts expecting Q2 gross domestic product (GDP) to rise to 2.8% from 1.4% and initial jobless claims to remain at 232.000. Investors will also be looking at the Fed’s key inflation gauge, the personal consumption expenditure price index, which may change from 2.6% to 2.7% YoY, according to preliminary estimates. It may reduce the likelihood of the interest rate change at the September meeting by –50 basis points.
In these conditions, the continuation of the sideways dynamics of the USD/JPY pair looks like the most likely scenario.
Support and resistance
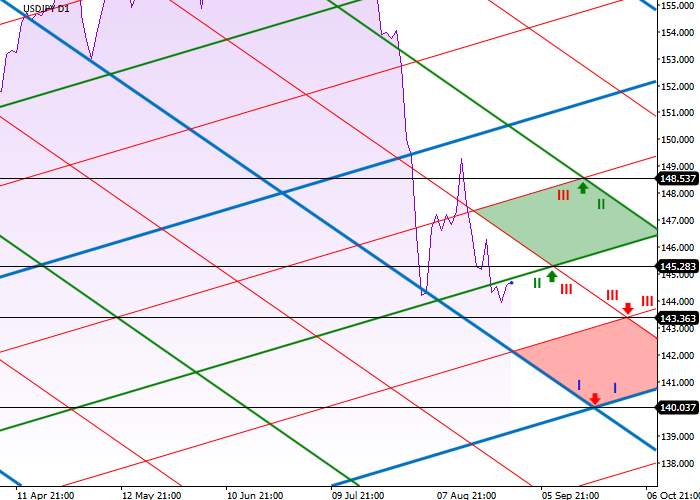
On the daily chart, the trading instrument entered a new range between the left resistance level of the first order (I) and the left support level of the first order (I), significantly increasing the probability of continuing the decline. Further dynamics may develop in a downward trend, where the local crossover of the left support of the third order (III) and the right support of the third order (III) 143.36 will become the new target. The long-term target may become the crossover of the left support of the first order (I) and the right support of the first order (I) 140.03.
In case of a reversal, the quotes will continue the upward trend to the crossover of the left resistance of the second order (II) and the right resistance of the third order (III) 145.28, and then to the crossover of the left resistance of the third order (III) and the right resistance of the second order (II) 148.53.
Resistance levels: 145.28, 148.53.
Support levels: 143.36, 140.03.

Trading tips
Short positions may be opened after the price consolidates below 143.36, with the target at 140.03. Stop loss – 144.10. Implementation period: 7 days or more.
Long positions may be opened after the price consolidates above 145.28, with the target at 148.53. Stop loss – 144.30.


Hot
No comment on record. Start new comment.