Current trend
The USDX index is testing 100.85: trading activity remains quite high, which is associated with the publication of the US Federal Reserve's decision on monetary policy the day before.
For the first time since 2020, the regulator lowered the cost of borrowing by 50 basis points to 5.00%, which, in general, coincided with market expectations, which were actively adjusted as the meeting date approached. However, until the very end, investors doubted whether the Fed would decide to reduce the indicator more rapidly, given the continuing inflation risks. Interest rates have been in the 5.25-5.50% range since July 2023, the highest level since 2001, as the US Federal Reserve monitored economic data for inflation approaching its 2.0% target. In addition, officials revised their Gross Domestic Product (GDP) forecasts for 2024 to 2.0% from 2.1%, while expectations for 2025 remained unchanged at 2.0%. In turn, preliminary estimates for inflation in the current year were changed from 2.6% to 2.3%, and for next year — from 2.3% to 2.1%. At the same time, the American regulator expects some deterioration in the situation on the labor market: in particular, in 2024, the forecast for the Unemployment Rate was revised upward from 4.0% to 4.4%, and in 2025 — from 4.2% to 4.4%. As for the interest rate, the median forecast of the members of the US Federal Open Market Committee (FOMC) suggests that it could fall to 4.38% by the end of 2024 and to 3.38% by the end of 2025, but, according to the Chair of the Fed Jerome Powell, decisions on its adjustment will be made on the basis of macroeconomic data.
Meanwhile, US macroeconomic data released on Wednesday provided modest support to the dollar: Building Permits in August rose 4.9% after –3.3% in the previous month, and the Housing Starts rose 9.6% after –6.8%.
Support and resistance
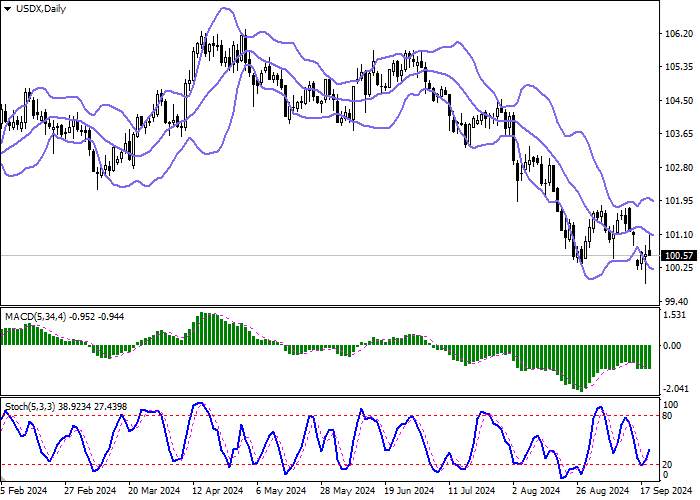
Bollinger Bands on the daily chart demonstrate a moderate decrease. The price range is slightly changing, being spacious enough for the current activity level in the market. MACD is trying to reverse upwards keeping a previous sell signal (located below the signal line). It is necessary to wait for the trade signals from the technical indicator to become clear. Stochastic, meanwhile, is showing more confident corrective growth, having retreated from the level of "20" the day before and signaling in favor of the development of "bullish" dynamics in the near future.
Resistance levels: 100.80, 101.20, 101.67, 102.00.
Support levels: 100.35, 100.00, 99.50, 99.00.

Trading tips
Short positions may be opened after a breakdown of 100.35 with the target at 99.50. Stop-loss — 100.80. Implementation time: 2-3 days.
The return of the "bullish" trend with the breakout of 100.80 may become a signal for new purchases with the target of 101.67. Stop-loss — 100.35.


Hot
No comment on record. Start new comment.