Current trend
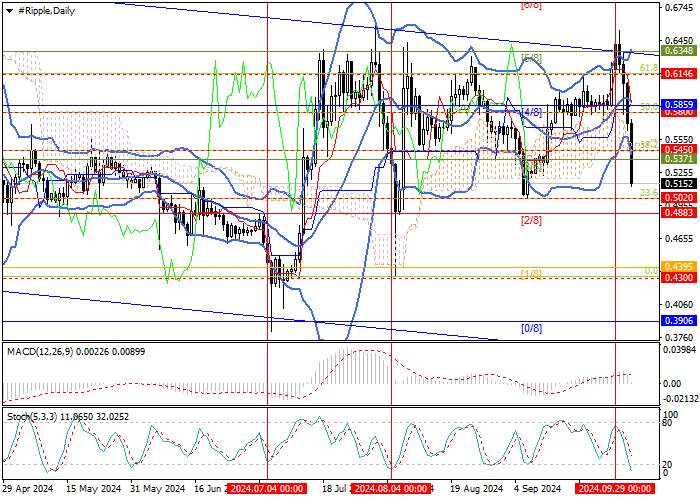
The XRP/USD pair is showing a rapid downward trend within the overall market trend. Quotes are trading in a sideways range of 0.6348–0.5020 (Murrey level [5/8], Fibonacci retracement 23.6%), the upper limit of which was tested over the weekend, but the price was unable to consolidate above it. Currently, the instrument is close to the lower boundary of the sideways range, consolidation below which will allow testing the targets of 0.4300 (Fibonacci retracement 0.0%, July lows area), 0.3906 (Murrey level [0/8]). Otherwise, if the "bears" fail to leave the specified channel, growth will resume with the prospect of quotes returning to the upper limit (0.6348).
Technical indicators point to the possibility of exactly this scenario for the XRP/USD pair: Bollinger Bands are still directed upwards, and the price chart has moved beyond the lower band, confirming an upward correction, Stochastic has dropped to the oversold zone, not excluding an upward reversal, but MACD is preparing to move into the negative zone, so a short-term decline is still likely.
Support and resistance
Resistance levels: 0.5450, 0.5859, 0.6348.
Support levels: 0.5020, 0.4300, 0.3906.
Trading tips
Long positions can be opened when the price reverses around 0.5020 with targets at 0.5450, 0.5859, 0.6348 and stop-loss at 0.4710. Implementation period: 5-7 days.
Short positions can be opened below 0.4883 with targets at 0.4300, 0.3906 and stop-loss at 0.5270.


Hot
No comment on record. Start new comment.