Current trend
The leading index of the American economy S&P 500 is correcting at 5698.0, while the prospects for further easing of the monetary policy of the US Federal Reserve support the growth of financial indicators of technology companies.
Today at 14:30 (GMT 2) in the US, data on the change in nonfarm payrolls will be published: analysts expect the indicator to grow to 147.0 thousand from 142.0 thousand, compared with recent preliminary data showing an increase to 143.0 thousand from 103.0 thousand. In turn, employment in the private non-farm sector may increase by 125.0 thousand from 118.0 thousand, which is also a positive signal for the American currency, confirming the opinion of many investors that a 50 basis point interest rate cut in November will not be needed, and the US Federal Reserve will adjust the value by only −25 basis points. According to the Chicago Mercantile Exchange (CME Group) FedWatch Tool, the probability of such a scenario is currently 66.0%, while just a week ago it did not exceed 48.0%.
The bond market is showing an upward correction: the rate on 10-year debt securities rose to 3.844% from 3.776% last week, on 20-year ones — to 4.237% from 4.114%, and on 30-year ones — to 4.117%, which is the maximum since September 2.
The leaders of growth in the index are MarketAxess Holdings Inc. ( 7.46%), Valero Energy Corp. ( 6.15%), Marathon Petroleum Corp. ( 5.72%), Vistra Energy Corp. ( 5.65%).
Among the leaders of decline are Constellation Brands Inc. Class A (−4.70%), Bio-Techne Corp. (−4.43%), Universal Health Services Inc. (−3.94%).
Support and resistance
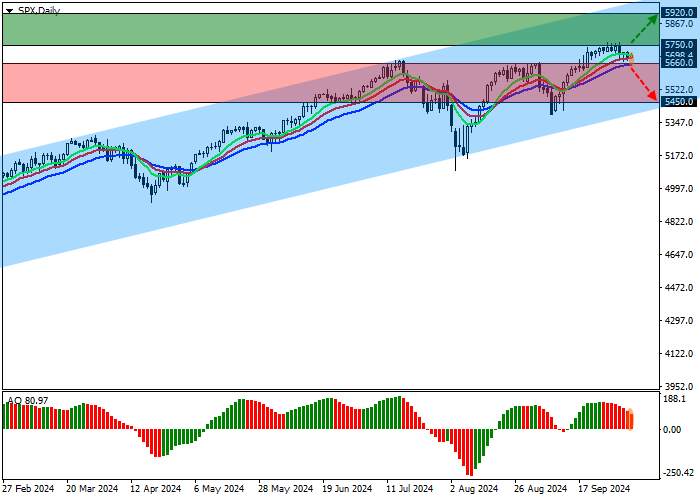
On the D1 chart, S&P 500 quotes are held in an ascending channel with dynamic boundaries of 6000.0–5400.0.
Technical indicators maintain a stable buy signal: fast EMAs on the Alligator indicator are moving away from the signal line, and the AO histogram, being in the buy zone, is forming correction bars.
Support levels: 5660.0, 5450.0.
Resistance levels: 5750.0, 5920.0.

Trading tips
If the asset continues to grow and consolidates above the resistance level of 5750.0, buy positions with a target of 5920.0 will be relevant. Stop loss – 5700.0. Implementation period: 7 days and more.
If the asset continues to decline and consolidates below the support level of 5660.0, sell positions with a target of 5450.0 can be opened. Stop loss – 5720.0.


Hot
No comment on record. Start new comment.