Current trend
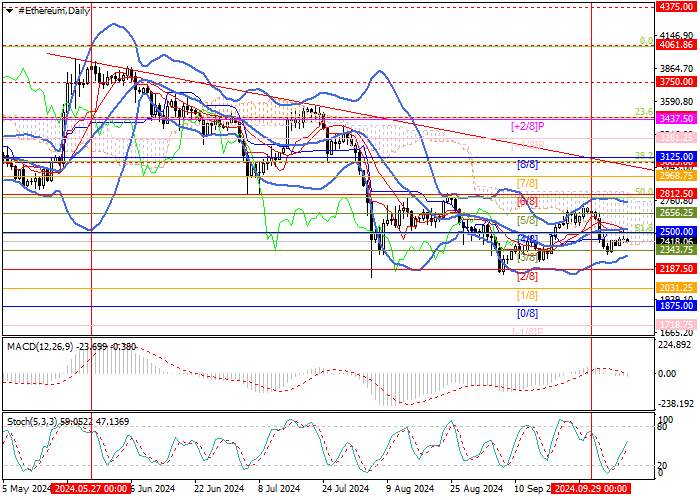
Last week, the ETH/USD pair resumed its decline within the long-term downtrend after a short-term growth attempt in September and is currently holding near the 2421.76 area.
Currently, quotes are trying to regain their positions and overcome the strong resistance level of 2500.00 (Murrey level [4/8], 61.8% Fibonacci retracement), supported by the central line of Bollinger Bands. If successful, the movement will continue to the targets of 2812.50 (Murrey level [6/8], 50.0% Fibonacci retracement), 3125.00 (Murrey level [8/8], 38.2% Fibonacci retracement). The key level for the “bears” seems to be 2187.50 (Murrey level [2/8]), consolidation below which will become a catalyst for achieving the targets of 1875.00 (Murrey level [0/8]) and 1718.75 (Murrey level [˗1/8]).
Technical indicators do not give a clear signal, illustrating the uncertainty in the market: Bollinger Bands are horizontal, MACD has moved into the negative zone, and Stochastic is directed upwards. Overall, given that the long-term downtrend continues, a resumption of price decline in the near future seems to be a more likely scenario.
Support and resistance
Resistance levels: 2500.00, 2812.50, 3125.00.
Support levels: 2187.50, 1875.00, 1718.75.
Trading tips
Short positions can be opened below 2187.50 with targets at 1875.00, 1718.75 and a stop-loss at 2400.00. Implementation period: 5–7 days.
Long positions can be opened above 2500.00 with targets at 2812.50, 3125.00 and a stop-loss at 2270.00


Hot
No comment on record. Start new comment.