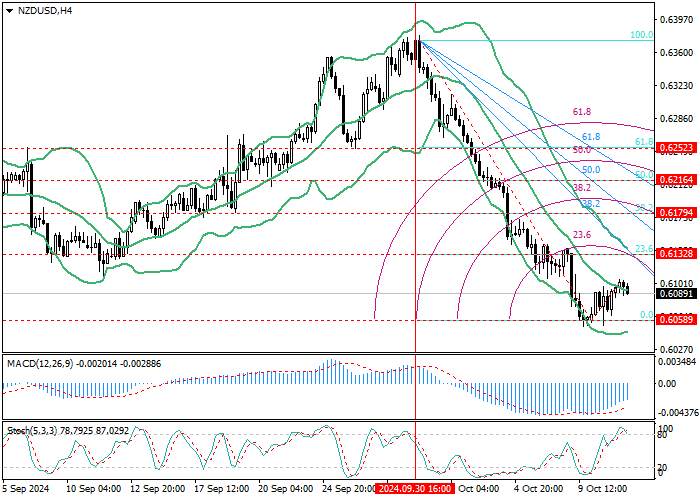
NZD/USD, H4
On the H4 chart, the NZD/USD pair is trying to start a corrective growth, reversing at 0.6058 (0.0% retracement, near three-month lows). If the price consolidates above the central line of Bollinger Bands, the upward dynamics will be able to strengthen towards the targets of 0.6179 (38.2% retracement) and 0.6252 (61.8% retracement). With a reverse breakdown down of the level of 0.6058, the decline will resume to the area of 0.5908 (61.8% Fibonacci extension).
Technical indicators allow for continued decline: Bollinger Bands are pointing downwards, Stochastic is preparing to leave the overbought zone and form a sell signal, MACD is growing, but remains in the negative zone.

NZD/USD, D1
On the D1 chart, the price reached 0.6055 (61.8% retracement), but cannot break below it yet. If successful, the targets for further decline will be 0.5986 (the area of intersection with the oncoming ascending fan) and 0.5875 (100.0% retracement). With a breakout of 0.6109 (50.0% retracement), the movement will continue to the targets of 0.6163 (38.2% retracement) and 0.6233 (23.6% retracement, the central line of Bollinger Bands).
Technical indicators do not give a clear signal: Bollinger Bands are reversing down, MACD has moved into a negative zone, confirming the formation of a downtrend, but Stochastic is preparing to leave the oversold zone, which does not exclude the possibility of corrective growth.

Support and resistance
In the near future, the continuation of the downward dynamics of quotes seems more likely. After the breakdown of the 0.6055 mark (0.0% retracement, H4; 61.8% retracement, D1), its targets will be 0.5986 (the area of intersection with the oncoming ascending fan, D1) and 0.5908 (61.8% Fibonacci extension, H4). If the price consolidates above the level of 0.6109 (50.0% retracement, D1; the central line of Bollinger Bands, H4), growth may resume to the levels of 0.6163 (38.2% retracement, D1) and 0.6252 (61.8% retracement, H4).
Resistance levels: 0.6109, 0.6163, 0.6252.
Support levels: 0.6055, 0.5986, 0.5908.
Trading tips
Short positions can be opened below the 0.6055 mark with targets of 0.5986, 0.5908 and a stop-loss around 0.6100. Implementation period: 5–7 days.
Long positions can be opened from the level of 0.6109 with targets of 0.6163, 0.6252 and a stop-loss around


Hot
No comment on record. Start new comment.