Current trend
During the Asian session, the WTI Crude Oil price is holding at 68.37, recovering after opening with a negative gap. The driver of the negative dynamics was the retaliatory attack of the Israel Defense Forces on Iranian territory, which was expected over the past month. It did not affect the oil infrastructure, and the likelihood of interruptions in the supply of raw materials from the region has significantly decreased. According to unconfirmed reports, official Tehran will not respond to these actions, which may lead to a gradual de-escalation of the conflict.
The market situation is complicated by poor growth in oil demand in China. Recent data on the profits of industrial enterprises in the country emphasize the poor prospects for the largest oil importer, putting pressure on the quotes. In addition, starting at the beginning of December, OPEC will begin to cancel the current cuts in oil production, which will increase the volume of supply on the market, negatively affecting the price of black gold. Turkey plans to begin oil and gas exploration in Somalia. A corresponding agreement was signed between the Turkish Petroleum Corporation (TPAO) and the Somali Petroleum Authority. The seismic research vessel Oruс Reis has already reached the shores of East Africa. Scientists will collect seismic data at three license areas, each about 5.0K square kilometers.
Meanwhile, American investors are focusing on October labor market statistics: according to forecasts, nonfarm payrolls will decrease from 254.0K to 140.0K, average hourly wages from 0.4% to 0.3%, and the unemployment rate will remain at 4.1%. On Thursday at 14:30 (GMT 2), investors will pay attention to the personal consumption expenditure price index, which is actively used by the US Fed when calculating the average inflation in the country. The September core indicator may increase from 0.1% to 0.2%.
Support and resistance
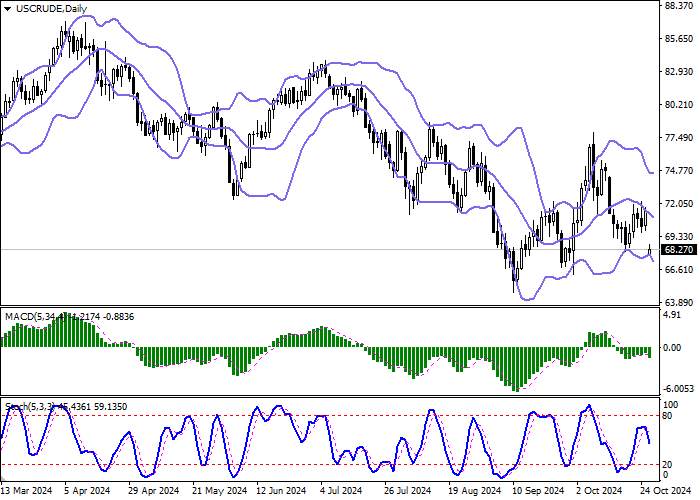
On the daily chart, Bollinger bands are actively declining. The price range is expanding from below, clearing the way for the “bears” to new lows. The MACD indicator is forming a poor sell signal (the histogram tends to be located below the signal line). Stochastic, without reaching the level of “80”, reversed downwards, reflecting the likelihood of a full-fledged downward trend in the ultra-short term.
Resistance levels: 69.06, 70.00, 71.00, 71.60.
Support levels: 68.15, 67.00, 66.00, 64.71.


Trading tips
Short positions may be opened after a breakout of level 68.15 downwards, with the target at 66.00. Stop loss — 69.06. Implementation period: 2–3 days.
Long positions may be opened after a breakout of level 69.06 upwards, with the target at 71.00. Stop loss — 68.00.


Hot
No comment on record. Start new comment.