NZD/USD, H4
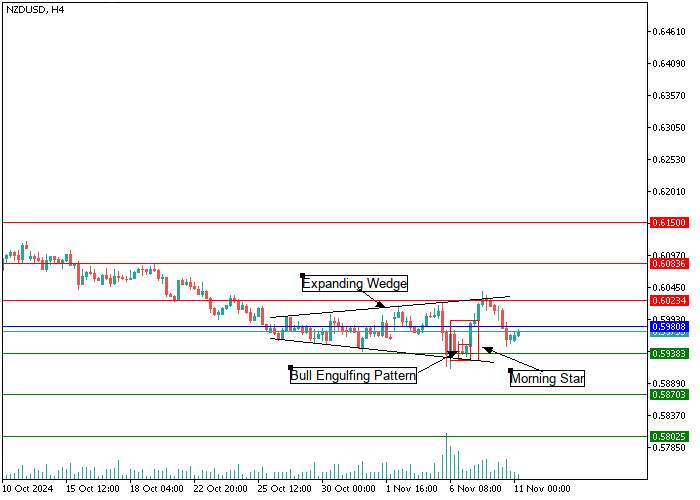
On the four-hour chart, a large graphic pattern, the Expanding Wedge, is being built, the way out of it is expected to be up and down and at the 0.5938 level, the Morning Star figure is being built, which includes a Bullish Engulfing Pattern. This combination signals that a low price area may be reached and the instrument is ready for a "bullish" reversal. Most likely, the price of the NZD/USD pair will recover to the key resistance level of 0.6023, allowing the instrument to continue moving towards the target of 0.6083–0.6150. An alternative scenario is possible if the "decline" strengthens their position below the main support level of 0.5938, then one can expect an increase in negative dynamics in the region of 0.5870–0.5802.

NZD/USD, D1
On the daily chart, the price is moving in a major downtrend, holding on to 0.5970, and in the range of 0.5938–0.6023, a series of Bullish Engulfing candlesticks is observed, indicating buyer activity and signaling a potential upward price reversal. Currently, the most likely scenario is the development of an upward trend to the key resistance level of 0.6150, overcoming and strengthening above which will pave the way for a "price increase" to the area of 0.6083–0.6150.

Support and resistance
Support levels: 0.5938, 0.5870, 0.5802.
Resistance levels: 0.6023, 0.6083, 0.6150.
Trading tips
A buy position can be opened above the 0.6023 level with a target at 0.6083, 0.6150. Stop-loss — 0.5980. Implementation period: 9-12 days.
A sell position can be opened below the 0.5938 level with a target at 0.5870, 0.5802. Stop-loss — 0.5980.


Hot
No comment on record. Start new comment.