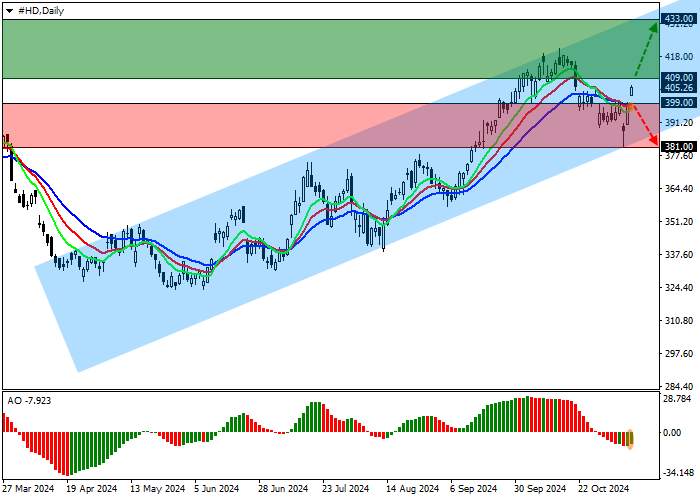
Shares of The Home Depot Inc., the largest home improvement company, are in a corrective trend at 405.00.
On the daily chart, the price is moving away from the support line of the ascending channel with dynamic limits of 435.00–390.00.
On the 4-hour chart, the probability of the upward momentum development increased after the reversal at the channel support level of 380.00, and after the consolidation of quotations above the maximum of 400.00, the annual extreme of 425.00 may be updated.
Technical indicators are ready to give a buy signal: the EMA fluctuation range on the Alligator indicator is widening in the upward direction, and the AO histogram is forming bullish bars in the negative zone.
Trading scenarios
Long positions can be opened after the price rises and stops above the level of 409.00 with the target of 433.00. Stop-loss — 404.00. Execution time: 7 days and more.
Short positions can be opened after the price falls and stops below the level of 399.00 with a target of 381.00. Stop-loss — 406.00.
Disclaimer: The views expressed are solely those of the author and do not represent the official position of Followme. Followme does not take responsibility for the accuracy, completeness, or reliability of the information provided and is not liable for any actions taken based on the content, unless explicitly stated in writing.
Like this article? Show your appreciation by sending a tip to the author.


Leave Your Message Now