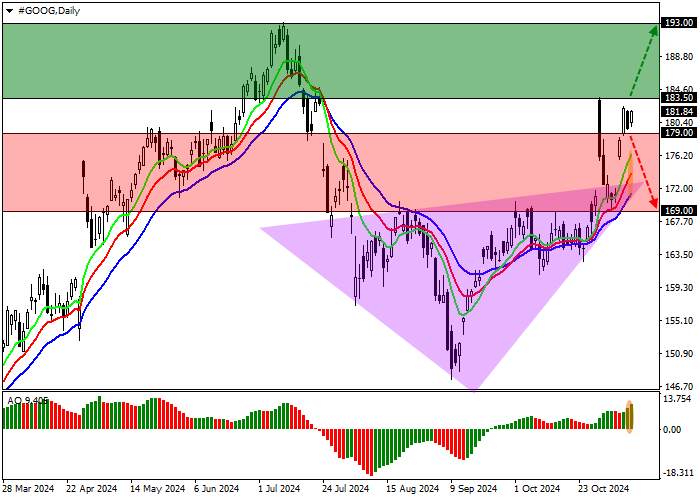
Shares of the American holding Alphabet Inc. are trading at 181.00.
A global correction trend is forming on the daily chart, within which the price is trying to retreat from the recently broken Head and shoulders pattern with the Neckline at 172.00.
On the four-hour chart, the quotes are approaching the high of October 30 at 183.00. A consolidation above will allow them to reach the year’s high of 193.00. Otherwise, the decline will continue to the pattern’s Neckline at 170.00.
Technical indicators are strengthening the buy signal: fast EMAs on the Alligator indicator are moving away from the signal line, and the AO histogram is forming ascending bars above the transition level.
Trading tips
Long positions may be opened after the price rises and consolidates above 183.50, with the target at 193.00. Stop loss is below 180.00. Implementation period: 7 days or more.
Short positions may be opened after the price falls and consolidates below 179.00, with the target at 169.00. Stop loss is 183.00.
Disclaimer: The content above represents only the views of the author or guest. It does not represent any views or positions of FOLLOWME and does not mean that FOLLOWME agrees with its statement or description, nor does it constitute any investment advice. For all actions taken by visitors based on information provided by the FOLLOWME community, the community does not assume any form of liability unless otherwise expressly promised in writing.


Hot
No comment on record. Start new comment.