Current trend
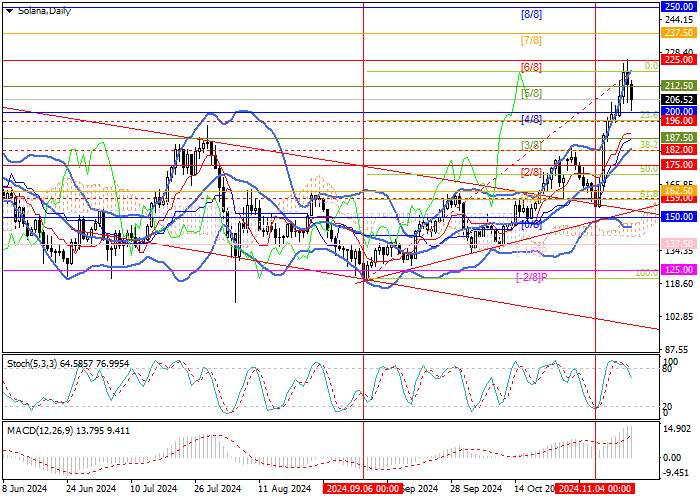
Last week, the SOL/USD pair actively grew within the general market trend against the backdrop of the election of Donald Trump as the new US President. The day before, quotes reached their highest values since November 2021 in the area of 225.00 (Murrey level [6/8]), after which they began a downward correction. If the support zone 200.00–196.00 (Murrey level [4/8], Fibonacci retracement 23.6%) is broken downwards, the decline will be able to develop towards the targets of 182.00 (Fibonacci retracement 32.2%, center line of Bollinger Bands) and 159.00 (Fibonacci retracement 61.8%).
The potential for strengthening the downward momentum and reversing the current trend appears limited as Bollinger Bands are directed upwards and MACD is increasing in the positive zone. Under these conditions, in the near future, the SOL/USD pair may test the annual highs in the area of 250.00 (Murrey level [8/8]) and 262.50 (Murrey level [ 1/8]).
Support and resistance
Resistance levels: 225.00, 250.00, 262.50.
Support levels: 196.00, 182.00, 159.00.

Trading tips
Long positions can be opened above 225.00 or when the price reverses around 182.00 with targets at 250.00 and 262.50 and stop-losses at 207.00 and 172.00, respectively. Implementation period: 5-7 days.


Hot
No comment on record. Start new comment.