Current trends
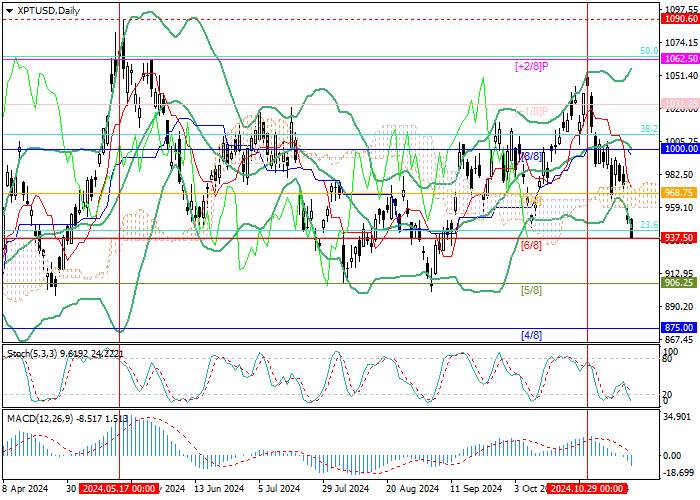
The XPT/USD pair has been actively declining since the beginning of this month. Currently, the price has reached a three-month low and is testing 937.50 (Murrey level [6/8]).
The precious metal remains under pressure from two main factors - the re-election of Donald Trump as US President and a possible slowdown in the pace of monetary easing by the US Federal Reserve. The return of a Republican to the White House has increased investor interest in the US dollar and put pressure on alternative assets. Experts predict that the implementation of the new economic program of the Head of State, which includes the introduction of increased tariffs on imported goods, as well as significant tax cuts, will make the United States more attractive for investment and will allow the national economy to receive a new impetus for growth.
On the other hand, these same steps could lead to an acceleration in the inflation rate and offset the impact of the measures already taken by the monetary authority, which could lead to a pause in adjustment or even a refusal to further reduce borrowing costs. Although Fed Chairman Jerome Powell said that the new administration's policies would not affect officials' actions in the short term, investors are concerned that the Fed may refrain from cutting interest rates by another 25 basis points in December and only bring them to 4.00-3.75% next year, instead of the previously expected 3.00%. In this case, the positions of the American currency may continue to strengthen.
Support and resistance
The XPT/USD pair is testing 937.50 (Murrey level [6/8]), which if broken will ensure the continuation of the decline to the targets of 906.25 (Murrey level [5/8]) and 875.00 (Murrey level [4/8]). The key level for the "bulls" seems to be 1000.00 (Murrey level [8/8]), supported by the middle line of the Bollinger Bands, and if it is broken, the growth of the instrument will be able to continue to the levels of 1031.25 (Murrey level [ 1/8]) and 1062.50 (Murrey level [ 2/8], 50.0% Fibonacci retracement).
Technical indicators show that the price is likely to continue falling: Bollinger Bands are turning down, MACD histogram is increasing in the negative zone and Stochastic is also pointing down.
Resistance levels: 1000.00, 1031.25, 1062.50.
Support levels: 937.50, 906.25, 875.00.

Trading tips
Sell positions can be opened below 937.50 with targets at 906.25, 875.00 and stop-loss at 958.00. Implementation period: 5-7 days.
Buy positions can be opened above 1000.00 with targets at 1031.25, 1062.50 and stop-loss at 980.00.


Hot
No comment on record. Start new comment.