
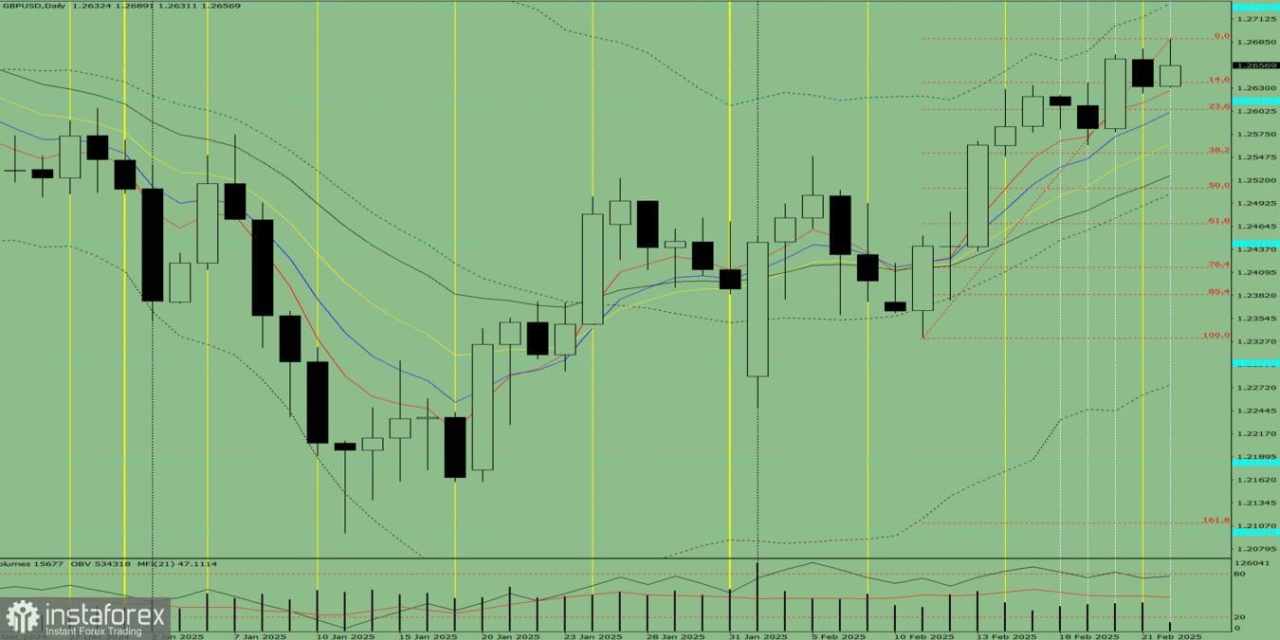
Analisis Tren (Gbr. 1) Pada hari Senin, pasar mungkin naik dari 1,2632 (harga penutupan hari Jumat) menuju 1,2734, batas atas Bollinger Bands (garis hitam putus-putus). Dari level ini, harga bisa mulai mengalami penurunan kembali menuju 1,2689, yang merupakan level fraktal atas (garis merah putus-putus).
Analisis Komprehensif
- Analisis Indikator: Bullish
- Level Fibonacci: Bullish
- Analisis Volume: Bullish
- Analisis Candlestick: Bullish
- Analisis Tren: Bullish
- Bollinger Bands: Bullish
- Prospek Grafik Mingguan: Bullish
Kesimpulan: Tren Diperkirakan Naik
Prospek pasar secara keseluruhan menunjukkan berlanjutnya pergerakan naik.
Skenario Alternatif
Jika harga naik dari 1,2632 menuju 1,2689 (fraktal atas, garis merah putus-putus), maka harga mungkin berbalik turun menuju 1,2636, yang sejalan dengan level retracement Fibonacci 14,6% (garis merah putus-putus).


Hot
No comment on record. Start new comment.